Why is my classic SharePoint page so slow?
Troubleshooting performance issues for SharePoint online can sometimes be a bit of a challenge. A lot of things can have impact on the performance of your page. Microsoft has now released a Chrome browser extension called Page Diagnostics. This tool can help you in your performance troubleshooting.
So what does it do?
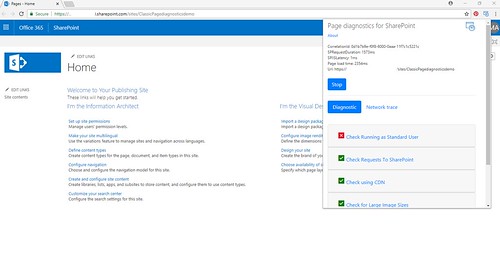
First of all it will give you some basic statistics of your page. It will for example show the page load time and the SharePoint request duration. All these statistics are in the top section of the extension panel.
It will also check how your classic page performs agains six basic rules, these are showed in the Diagnostics tab below the statistics. It will check for instance if you are using large images on your page. This can of course slow down your page. The other rules are described on this Microsoft support page. When your page doesn’t pass one of these checks it will also provide you with details about the issue and how you can possibly fix this.
And finally it can also get an overview of the requests in the Network trace tab. You can even export this in JSON format.
Below is an example of a test with this extension. I used an empty welcome page of a classic Publishing Portal. Notice how it fails on the first check because I am using a Global Admin account to run this test.
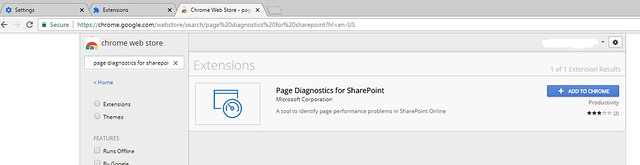
How do I get this tool?
Simply download the extension in Chrome. Visit the Chrome Web Store in a Google Chrome web browser and search for the Page diagnostics for SharePoint extension. Add it to your Chrome browser.
Want to know more?
I can recommend the announcement blog on Techcommunity or the Microsoft Support article I mentioned earlier.
Good luck with troubleshooting!